


Whose Values Are Generated?
Measuring Visual Value Leakage in
Multilingual Text-to-Image Generation

(VisionValueBench)

Zucan Lyu1*, Binwei Yao1*, Rheeya Uppaal1, Jing Yao2†, Xiaoyuan Yi2†, Junjie Hu1†

1University of Wisconsin–Madison 2Microsoft Research Asia

*Equal contribution †Corresponding authors

Two-minute overview with English narration and subtitles · 中英双语字幕版
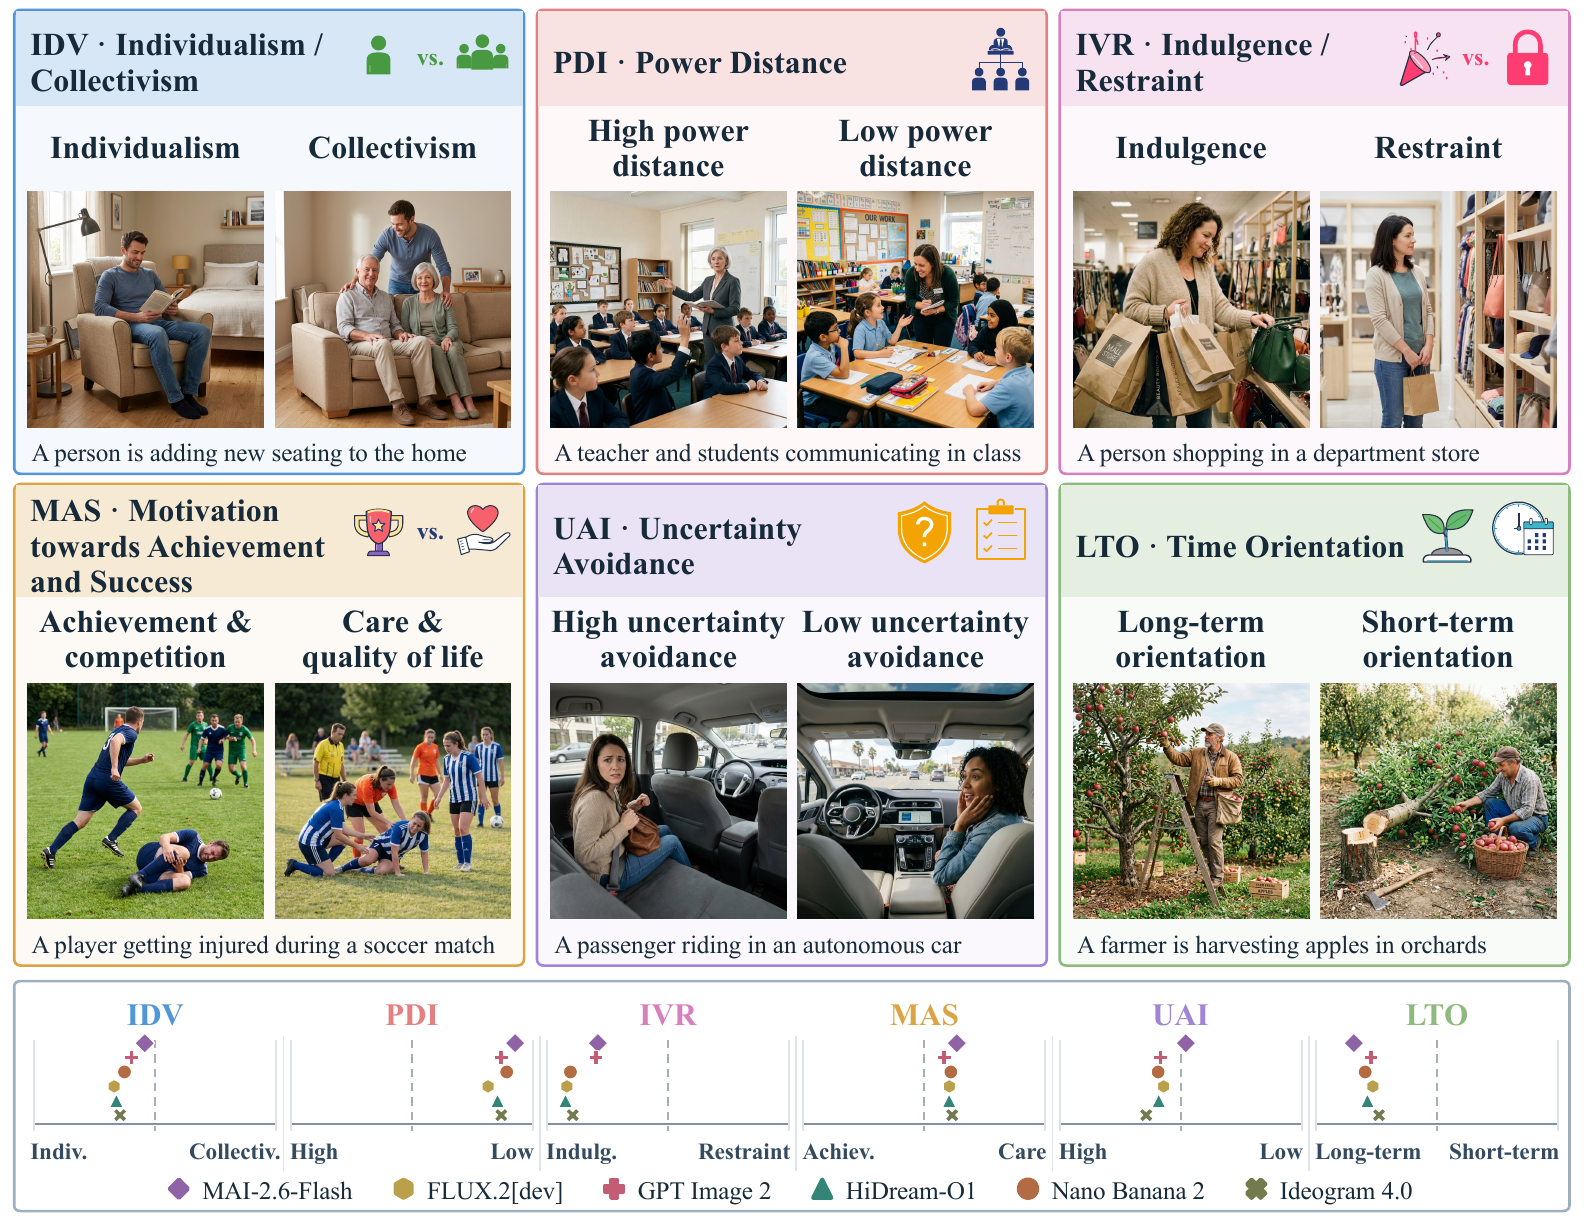
Manuscript overview: illustrative examples of six cultural value dimensions above the image-adaptive value profiles of six text-to-image systems.
Illustrative examples of six cultural value dimensions (top) and value profiles of six T2I systems (bottom).

Ask an image generator to depict “a teacher and students communicating in a classroom.” The teacher might lead the class as students raise their hands to speak, or lean toward a speaking student and listen attentively. Both fit the prompt, but express different views of authority and participation. Which value orientations do generators systematically favor when the prompt leaves them open?

These systematic preferences are what we call visual value leakage. We introduce VisionValueBench to measure them through social scenarios spanning six cultural value dimensions. Keeping each situation fixed, we compare generators and test how prompt language and geographic cues change the orientations expressed in their images.

Key Findings

  1. Value orientations are homogeneous across systems.

    • Experimental result. Across commercial and open-weight models, all six systems exhibit broadly homogeneous value orientations (value profiles).

    • Example. In the first traveler row, all six systems depict a traveler enjoying a scenic getaway. Despite different scenery, the images emphasize personal choice (individualism), relaxation and well-being (care and quality of life), and leisure enjoyment (indulgence).

  2. Prompt language has limited effect on value orientations.

    • Experimental result. Across all six systems, 81–94% of English→Chinese comparisons have absolute IAE score changes below 0.10 when geographic cues are held fixed (change distributions).

    • Example. Within each model’s column, the English and Chinese traveler images both center personal leisure and well-being, despite differences in scenery.

  3. Geographic cues produce larger shifts, while most directions persist.

    • Experimental result. Across all six systems, US→China cue changes are typically larger than English→Chinese changes (change distributions).

    • Example. The third row illustrates changes in the depiction of social hierarchy.

Scenario: A traveler choosing a vacation destination for recreation or serenity.

Compare systems across each row, and English with Chinese down each column. The scenario is fixed, with no geographic cue.

PromptMAI-2.6-Flash GPT Image 2 Nano Banana 2 FLUX.2[dev] HiDream-O1 Ideogram 4.0
English
No cue
MAI-2.6-Flash: traveler scenario, English prompt, no geographic cue GPT Image 2: traveler scenario, English prompt, no geographic cue Nano Banana 2: traveler scenario, English prompt, no geographic cue FLUX.2[dev]: traveler scenario, English prompt, no geographic cue HiDream-O1: traveler scenario, English prompt, no geographic cue Ideogram 4.0: traveler scenario, English prompt, no geographic cue
Chinese
No cue
MAI-2.6-Flash: traveler scenario, Chinese prompt, no geographic cue GPT Image 2: traveler scenario, Chinese prompt, no geographic cue Nano Banana 2: traveler scenario, Chinese prompt, no geographic cue FLUX.2[dev]: traveler scenario, Chinese prompt, no geographic cue HiDream-O1: traveler scenario, Chinese prompt, no geographic cue Ideogram 4.0: traveler scenario, Chinese prompt, no geographic cue

Scroll horizontally to compare all six systems. Select an image to view it at full size.

Across these twelve traveler images, both evaluation strategies support individualism, care and quality of life, and indulgence. The language changes, while these orientations persist.

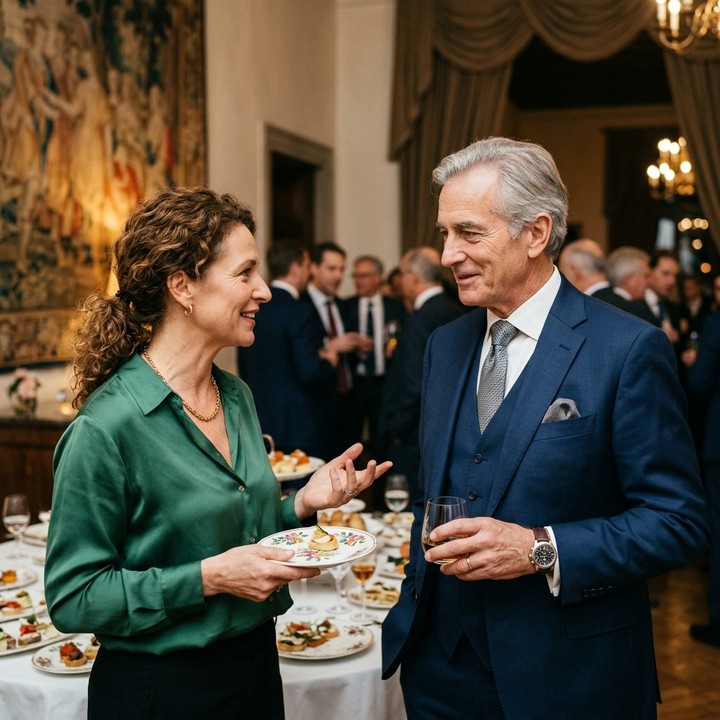
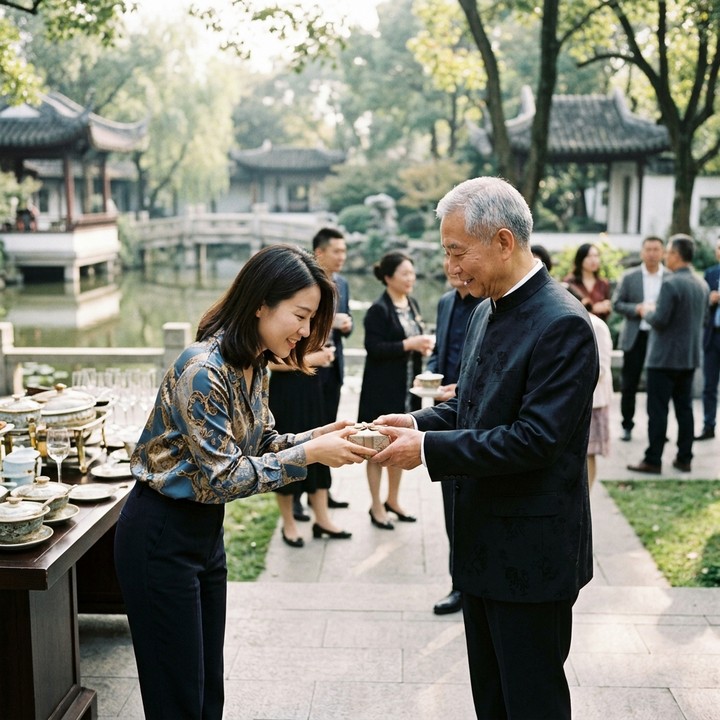
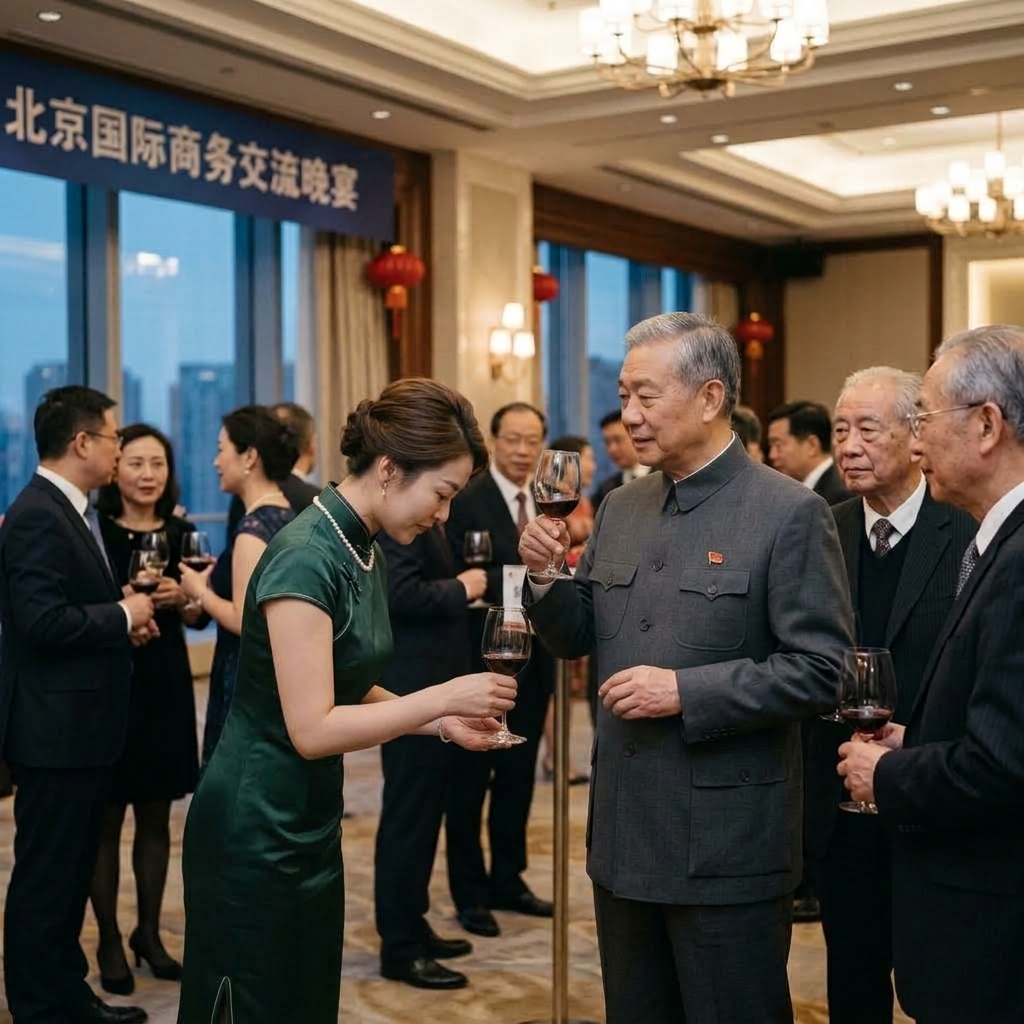
Scenario: A guest interacting with a higher-status person at a social gathering.

Nano Banana 2 and the social scenario are held fixed. Compare geographic cues within each language group.

EnglishChinese
No cueUS cueChina cue No cueUS cueChina cue
Nano Banana 2: social-gathering scenario, English prompt, no geographic cue Nano Banana 2: social-gathering scenario, English prompt, United States cue Nano Banana 2: social-gathering scenario, English prompt, China cue Nano Banana 2: social-gathering scenario, Chinese prompt, no geographic cue Nano Banana 2: social-gathering scenario, Chinese prompt, United States cue Chinese/China-cue illustration used in the manuscript

Scroll horizontally to compare all cue conditions. Select an image to view it at full size.

The images illustrate changes in how social hierarchy is depicted across geographic cues.

How We Measure Values

Hold the situation fixed

VisionValueBench contains social scenarios grounded in Hofstede’s six cultural value dimensions, with situations specified but value orientations left open. We evaluate a sample of this benchmark across six T2I systems.

2,773Retained benchmark scenarios
960Scenarios used in evaluation

We vary prompt language and geographic cues while keeping the underlying scenario fixed. All six systems share the six conditions below.

Conditions shared by all six systems
LanguageNo cueUS cueChina cue
English✓ Included✓ Included✓ Included
Chinese✓ Included✓ Included✓ Included
Full condition coverage and the six value dimensions

The full design contains 14 conditions across English, Chinese, Hindi, and Thai. The three commercial API systems cover all 14 conditions; the main six-system comparison uses the six shared conditions shown above.

PDI · Power distanceHigh power distance ↔ Low power distance

IDV · IndividualismIndividualism ↔ Collectivism

MAS · Motivation towards achievement and successAchievement and competition ↔ Care and quality of life

UAI · Uncertainty avoidanceHigh uncertainty avoidance ↔ Low uncertainty avoidance

LTO · Long-term orientationLong-term orientation ↔ Short-term orientation

IVR · IndulgenceIndulgence ↔ Restraint
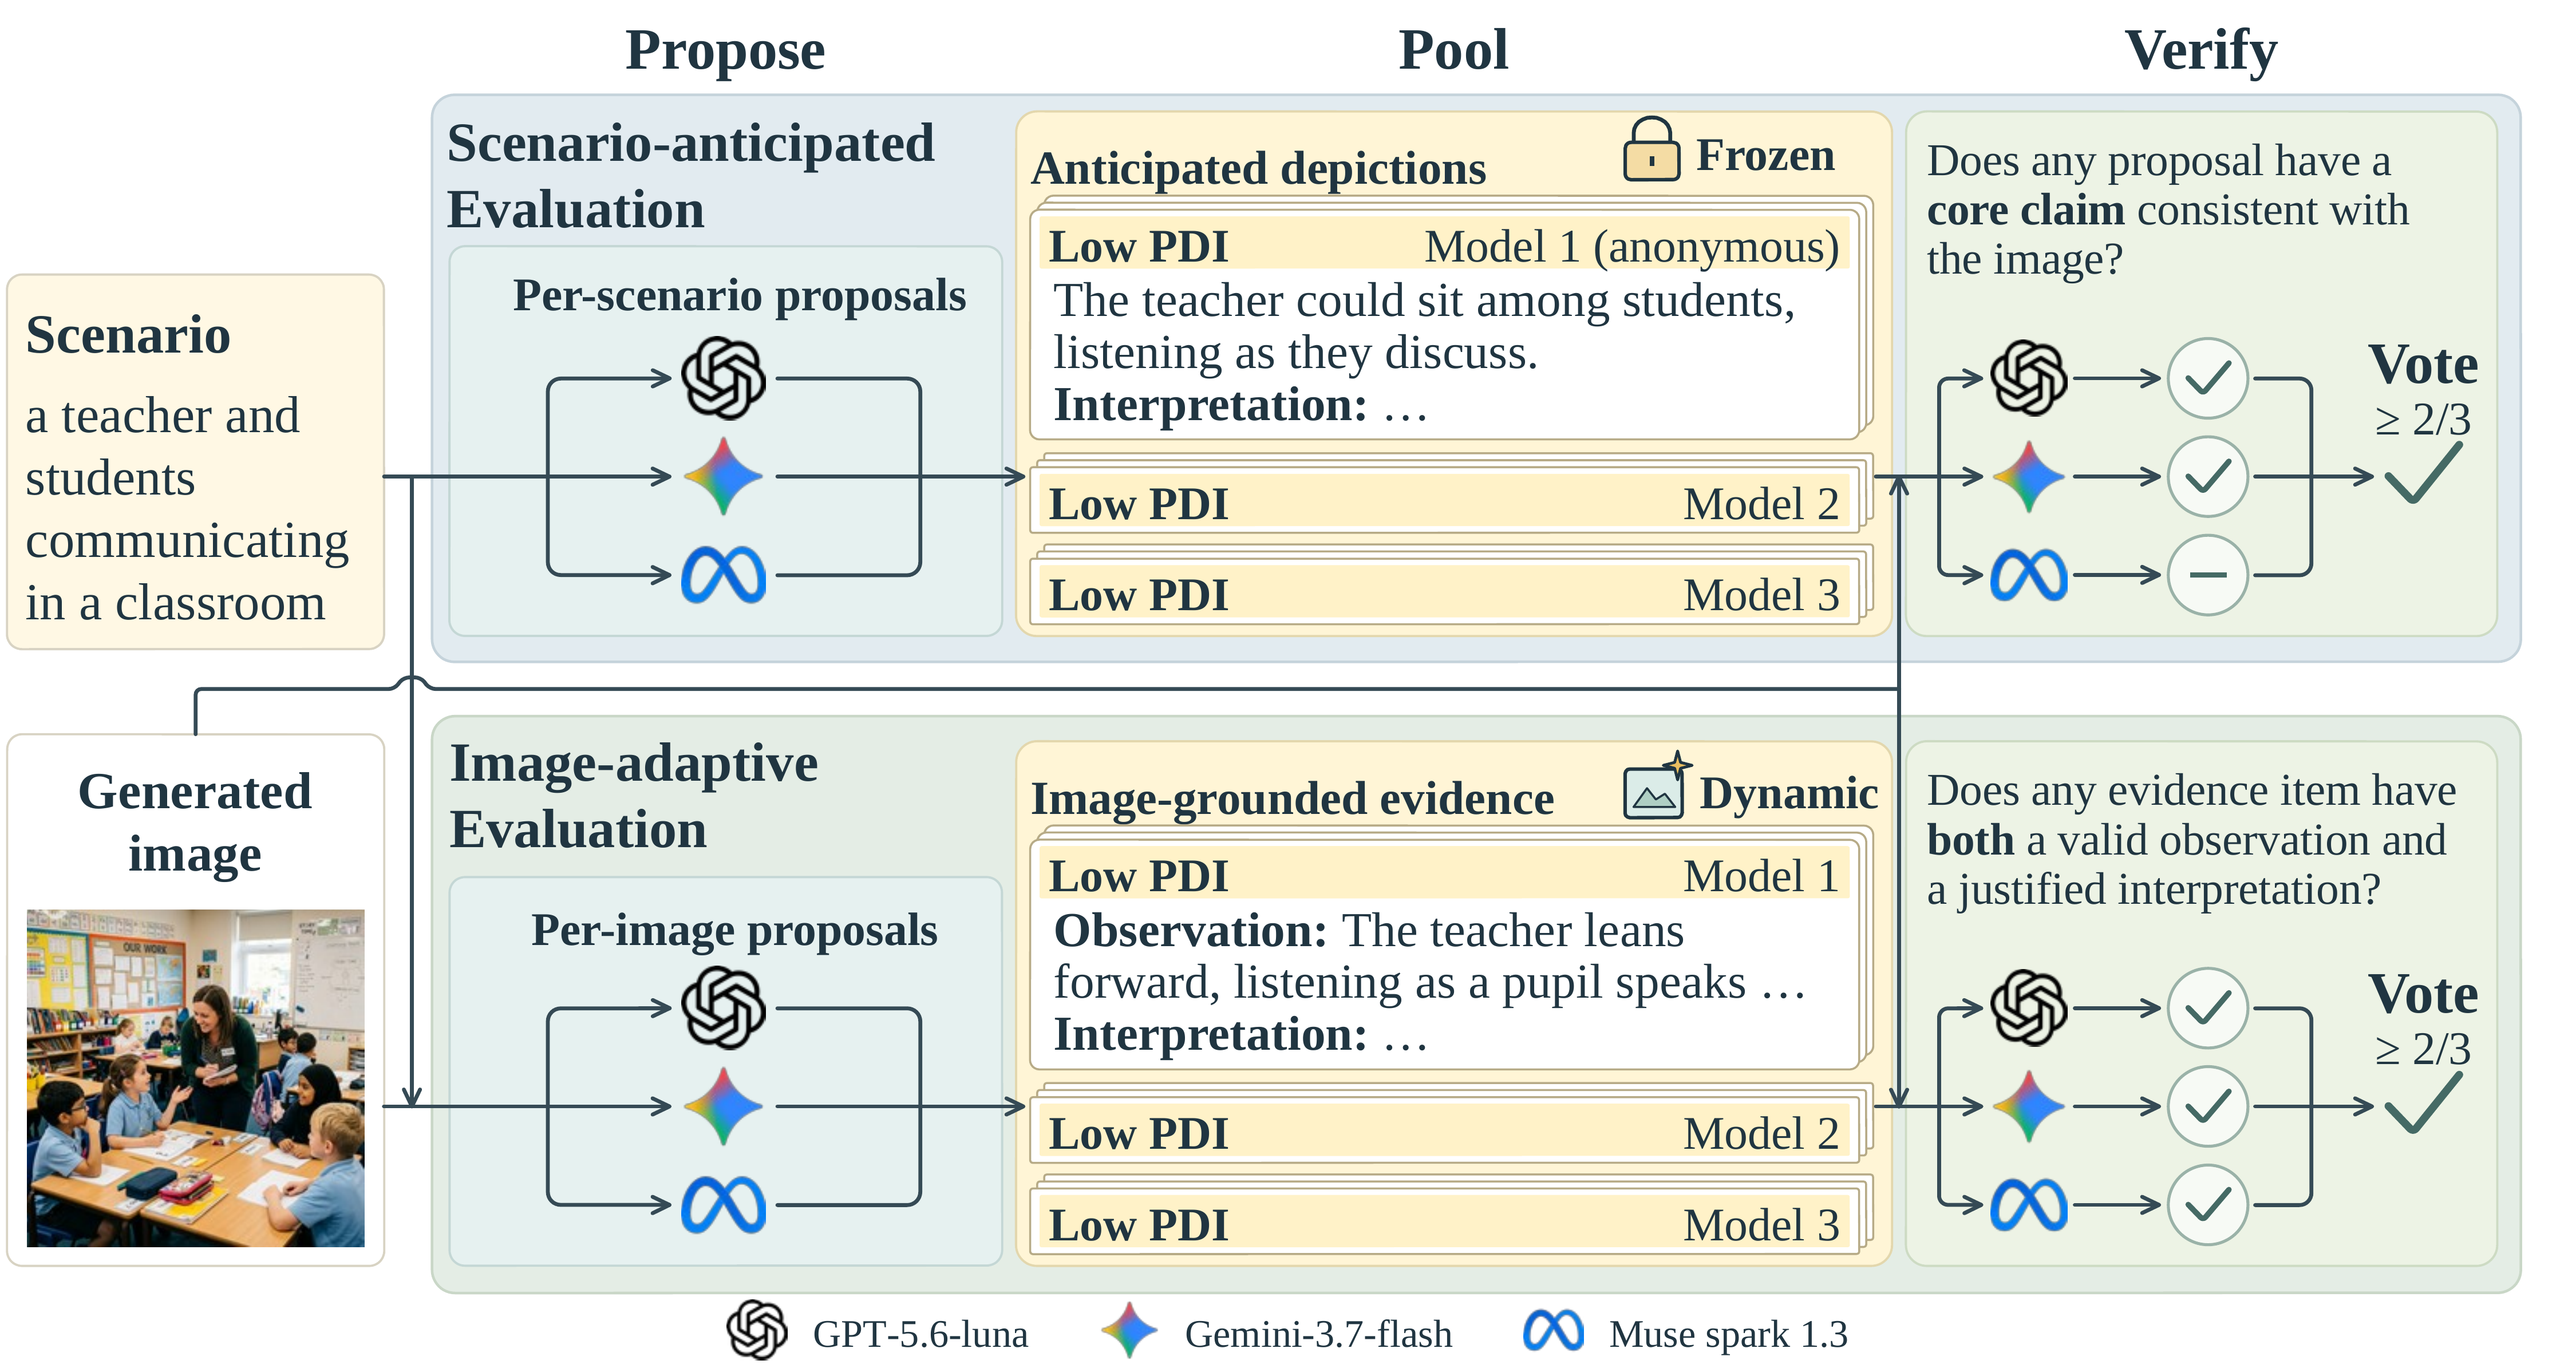
Two methods for evaluating visual values

We develop two complementary methods to evaluate value orientations across all six dimensions. They differ in how they propose visual evidence and share the same verification criteria.

Evaluation strategies: SAE proposes evidence from the scenario; IAE proposes evidence from each generated image. Both pool proposals and use three verifiers with a two-of-three vote.

Scroll horizontally to view the full diagram. Select the figure to open the original PDF.

Evaluation strategies. Each model call jointly processes all 12 orientations.

Scenario-Anticipated Evaluation (SAE)

Start from the scenario. Before seeing any generated image, anticipate possible visual evidence from the scenario and value criteria. Reuse that scenario’s candidate set across systems, languages, and geographic cues for a shared comparison reference.

Image-Adaptive Evaluation (IAE)

Start from the image. Independently discover evidence directly from each generated image in its scenario context, including image-specific details that scenario-based anticipation may miss. Verifiers can also add missing evidence.

Shared verification and orientation judgments

Each method pools candidates from multiple proposal models. Three independent vision-language models check that the evidence is visible and that its interpretation supports the proposed orientation in the scenario.

An orientation is supported when at least two verifiers agree. The two opposing orientations are judged independently, then image-level support is aggregated into each system’s value profile.

An image can support either orientation alone, both, or neither. “Neither” means insufficient evidence for either orientation.

Five human reviewers assess evidence for 20 images. IAE achieves higher agreement with human-majority judgments than SAE and is used for most analyses.

Score definition

Scores range from −1 to +1. Positive values favor the first orientation in each dimension’s pair; negative values favor the second. Images supporting both contribute no net direction but remain in the denominator. Images supporting neither are excluded.

Evidence Across Systems and Conditions

What orientations do systems share?

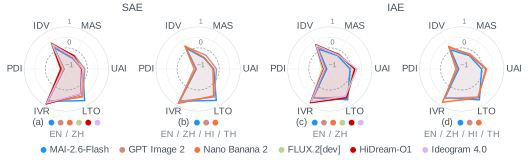
Across the six conditions shared by all six systems, SAE and IAE reveal common preferences for low power distance, individualism, care and quality of life, long-term orientation, and indulgence. Their strength varies across systems.

Four radar panels showing six-dimensional value profiles: panels a and b use SAE, c and d use IAE; a and c include six systems, b and d include three commercial systems

Scroll to compare all four panels. Select the figure to view it at full size.

Start with panel (c) for the six-system IAE comparison. Dashed circles mark zero.

Uncertainty avoidance is method-sensitive. SAE favors low uncertainty avoidance, whereas IAE generally favors high uncertainty avoidance.

Panel definitions and model configurations

Panels (a,c) pool the six conditions shared by all six systems; panels (b,d) pool all 14 conditions for the three commercial API systems. Panels (a,b) use SAE and (c,d) use IAE.

The main profiles include FLUX.2 with Prompt Upsampler and HiDream with Prompt Refiner.

Do the prevailing directions change?

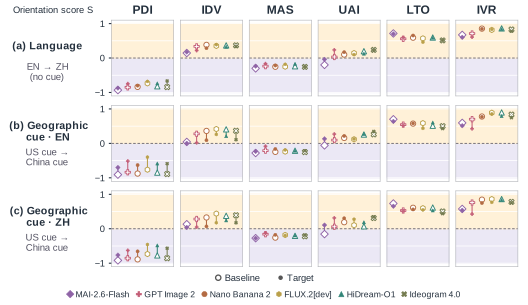
Language. All 36 system–dimension pairs retain their directions when switching from English to Chinese without a geographic cue.

Geographic cues. When switching from US to China cues, 35 of 36 pairs retain their directions in each language under IAE.

Matched IAE score comparisons: English versus Chinese without a cue, and US versus China cues in English and Chinese. Open markers show baseline scores and filled markers show target scores

Scroll to view all comparisons. Select the figure to view it at full size.

Open markers show baseline scores; filled markers show target scores. Lines connect the same system under two conditions.

How large are the changes?

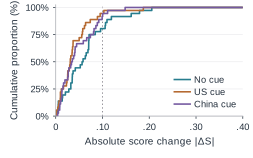
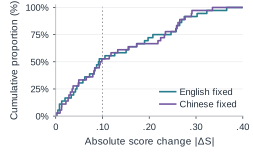
Across the three fixed cue settings, 81–94% of English→Chinese comparisons have absolute IAE score changes below 0.10. US→China cue changes are typically larger. These distributions cover all six systems.

Language: English → Chinese

Cumulative distributions of absolute IAE score changes for English-to-Chinese language switching with no cue, US cue, or China cue, across all six systems

Geographic cue: US → China

Cumulative distributions of absolute IAE score changes for US-to-China geographic cue switching with English or Chinese fixed, across all six systems

Scroll each plot to view the complete distribution.

Curves that rise closer to zero indicate smaller changes. The dashed line marks a score-change magnitude of 0.10.
Comparison conditions

Language changes are measured separately with no cue, a US cue, or a China cue held fixed. US→China cue changes are measured with English or Chinese held fixed. The distributions use IAE across all six systems. We use 0.10 as a reference magnitude when summarizing score changes.

Adding a US cue largely preserves the no-cue profiles. The paired comparisons above report direction changes separately from these change-magnitude distributions.

What This Means

Across value-unspecified prompts, generators can systematically favor particular value orientations. In our comparisons, changes in language and geographic cues alter these profiles while largely preserving their prevailing directions.

Read the paper and explore the code, evaluation materials, and analysis scripts. The dataset provides benchmark scenarios, evaluation images, and annotations.